Dissolving gender orientation and identity: the impact of LGBTQ promotion on population trends
A recurring argument presented as axiomatic in public debates, is that homosexuality and other non-heterosexual identities are not a matter of preference, upbringing or choice, that they are not a fashion and cannot be learned. According to a statement issued by a group of Hungarian psychologists, "there is no credible, methodologically sound scientific evidence to support the idea that children become LGBTQI+ people as a result of meeting people from this group, either in person or through fiction."
Research on LGBTQ issues is heavily funded, and we are now in a position where there is sufficient statistical data to determine whether the mainstreaming of LGBTQ issues since the early 2000s has had a detectable impact on the change in LGBTQ population. The broad public presence of the issue has an equal rights aspect - which eventually translates into legislation - and a strong cultural aspect, which is the presentation and promotion of LGBTQ lifestyles and people through theatre, film, television and other media, as well as through so-called sensitisation programmes. In both areas, significant steps have been taken in the last twenty years to serve the LGBTQ community. In the legal field, the protection of minorities and the legalisation of gay marriage in many countries, including the US and the UK, have been the most significant. In the cultural sphere, the number of productions incorporating the issue has multiplied.
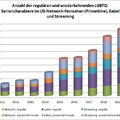
The best way to quantify the cultural impact of the LGBTQ movement is through the GLAAD Media Institute's annual report. GLAAD monitors LGBTQ characters: both regular and recurring, in series shown on US national network television, cable and streaming channels. It does not measure the number of secondary characters who appear in only one episode, but if this were added, the LGBTQ presence would be even more pronounced.
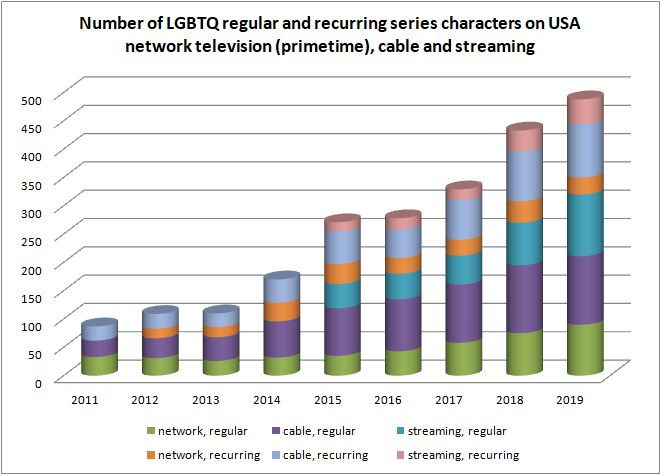
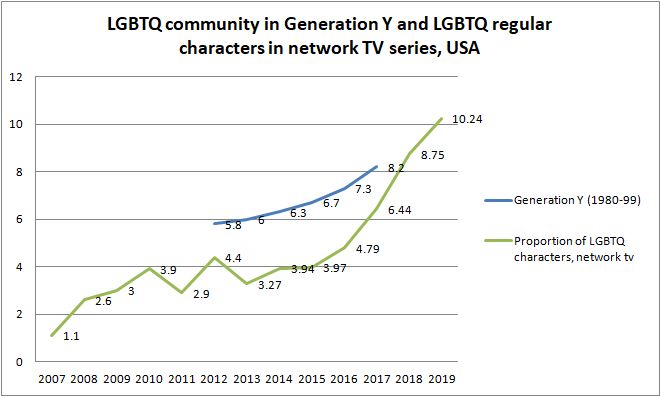
While 1.1% of prime-time shows on network tv in the U.S. featured LGBTQ characters in 2007,[1] that number rose to 4% between 2012 and 2014
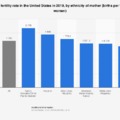
and in 2019 it is now 10%, more than the double of the 4.5% representation of the group in the general population (2017).
With the rise of cable and streaming, the number of LGBTQ characters has multiplied, more than fivefold since 2011, with a total of 488 LGBTQ regular and recurring characters appearing in US series in the 2019 season. This is a clear indication of the massive expansion in the cultural space. This trend has not escaped Europe and Hungary. Changes in content consumption habits, the rise of cable operators and especially streaming have further internationalised the media market, under the cultural dominance of the US.
There are two large population-based studies available after 2010 that allow us to examine changes in the LGBTQ population. One is Gallup's US survey from 2012-2017, based on around 340,000 interviews per year [2] and the British Office for National Statistics' survey of 320,000 people [3], which is more accurate than Gallup's because, with a near identical sample size, the UK population is only 66.7 million, a fraction of the US.
I do not look at data before 2010 because it is reasonable to assume that the increase there may be due to the abandonment of the previous hiding, i.e. it is not a real increase, but simply an increase in the LGBTQ community's confidence in research, and therefore more people are coming out. There was a 1% heterosexual dropout rate between 2006 and 2013, according to the US National Survey of Family Growth[4].
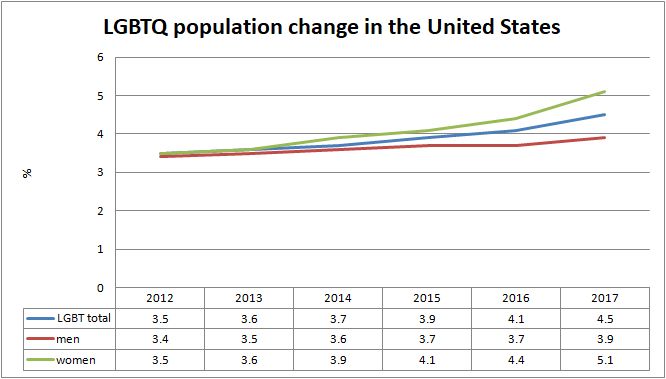
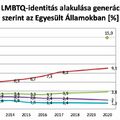
Between 2012 and 2017, the LGBTQ community grew by 29% to reach 4.5% of the total population, with women accounting for a significant share of this growth (+46%) while men increased by 15%. The trend is clear, with an almost 50% increase in the female population, with an increase of 10-12% per year in the previous year base and 24% in the last year. It is noteworthy that while in 2012 there was no difference between women (3.4%) and men (3.5%), by 2017 the gender gap had opened significantly.
The breakdown by birth cohort tells us more about the processes:
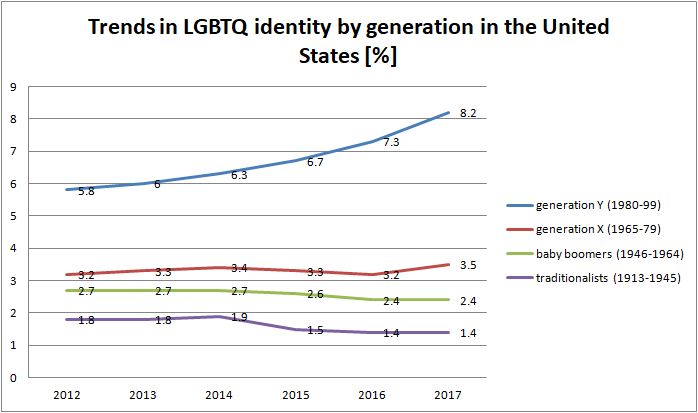
For the young generation, LGBTQ growth starts from a high base of 5.8%, and it's extreme high:+41%, on a steepening curve their share reaches 8.2%. For the over-35s, their share has increased by +9% to 3.5%, with a decreasing trend for the older generation. The young generation therefore accounts for almost all of the overall increase. This is also reflected in the recent age pyramid:
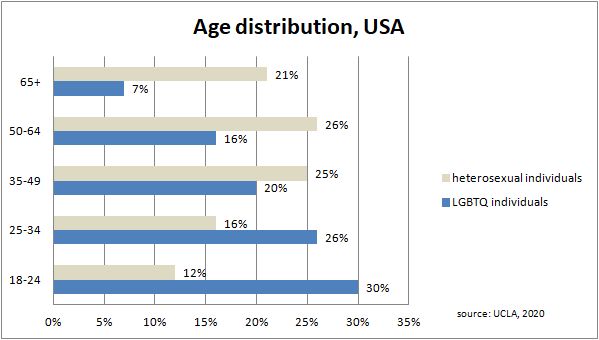
Looking at the graph, we see a real "African-like" demographic explosion, a pine-tree-shaped growth in the LGBTQ population. Over half of the total community, 56%, are under 34 years old and 30% are under 24. This shows, referring back to the previous graph, that the largest increase within Generation Y was among young people aged 18-24.
If we fit the curve measured in Generation Y to a graph with the share of LGBTQ TV series stars chosen as a measure of cultural trends, we see a preliminary upward trend in TV between 2007 and 2012. As the slope of the cultural trend curve increases, so does the slope of the Generation Y curve.
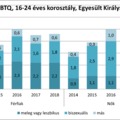
Gallup's publicly released data does not show how the growth is distributed in which letters of the LGBTQ community dominate. However, the British survey makes all the data available. In Britain, we see the same trends, and we can see the community composition there. Here, the youngest are also over-represented, with 16-24 year olds making up 29% of the total community while 25-34 year olds account for 20%.
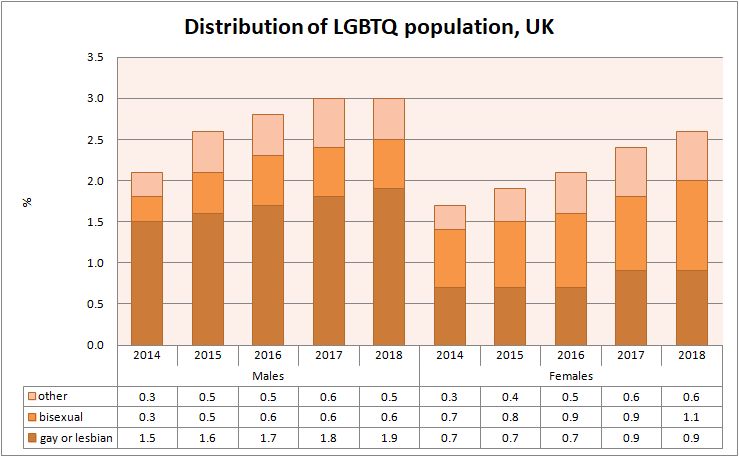
For both sexes, we see a steady increase. While men show the largest increase in homosexuality in the overall population (+27%), women show a dominant increase in bisexuality (+57%). It is slightly different for the youngest age group.
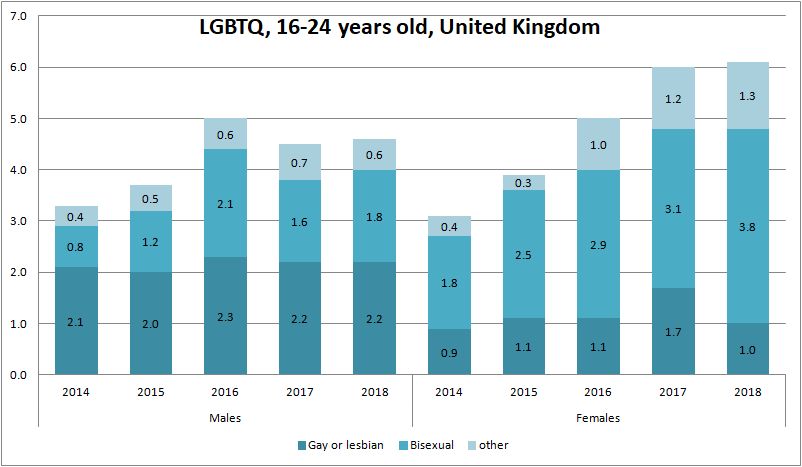
For the youngest women, the number of bisexuals increased much more - more than doubling - to a record 3.8%. The number of lesbians is stagnating, but the other category (transgender, queer) has also seen a significant increase of 0.9%. For men, homosexuality is stagnating here, similar to women. Bisexuality has doubled from a smaller base, but still reached 1.8%. In England, this age group also produces the highest numbers, with 4.6% of men and 6.1% of women identifying as LGBTQ.
Bisexual opening and the increase in the "other" category are also a trend in the 25-34 age group, but here the increase in the gay category is significant for men, from 2.1% to 3% - an increase of almost 50%.
Conclusions
In parallel to the strong cultural impact on US and UK societies, the LGBTQ community has experienced an intense growth. In both countries, the largest growth spurt has been in the young 16-34 age group. This is a very important indication that the young age group is the most open and sensitive to cultural influences - a 40-50 year old is much less likely to change their lifestyle and habits than a 16 year old teenager or young adult. These young people, in addition to being open to cultural impulses, do not carry the "social scars" of their elders, having grown up in a changing social climate. This also means that there is no reason to assume that a significant part of the increase among the youngest is due to the abandonment of earlier hiding.
One important lesson from the statistics among young people in the UK is that the proportion of homosexuals has not moved at all over the four years measured. The likely cultural effect among young people was not an increase in the number of homosexuals, but of bisexual and transgender persons: an indication that cultural influence and social sensitisation cannot be used to turn someone from heterosexual to homosexual. However, the +50% increase in homosexuality among British men aged 25-34 is worthy of a separate study. The disaggregated US data is not known to me.
The cultural influence has opened the door to experimentation in the younger generation, both in terms of multiple sexual orientation and gender identity, with bisexuals doubling in number across all genders and transgender numbers also rising significantly. The idea of fluidity can be important in understanding the changes now taking place: bisexuals, who have seen the largest increase, are characterised by a 'fluidity' or fluctuation in sexual orientation, while gender-fluid people who belong to the transgender group, are characterised by a fluctuation in gender identity, which may be combined with a change in sexual interest.
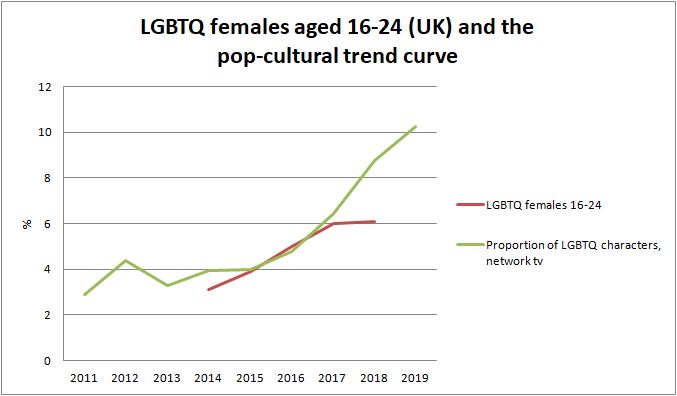
It strongly seems that a kind of LGBTQ fashion or trend-following or social conformity conversion has been born in the young generation in parallel with the popularisation of LGBTQ. This seems to affect women more than men. Our curve measuring cultural trends is steadily rising in parallel with the number of young LGBTQ people, and where its slope is rising, the slope of the young people's curve is rising. There doesn't seem to be much of a "solidification" back into heterosexuality, because heterosexual attrition is a trend in all age groups, except 65+, where it is virtually stagnant.[5]
Gallup attributes the sharp increase in the US survey to an increase in respondent confidence among young people. If this were the case, they would have to measure an increase in the older age group, since their socialisation took place in a non-inclusive environment. In contrast, those born in the middle of Generation Y were only 10 years old in 2000, and their growing up was accompanied by a rise in LGBTQ rights and social acceptance. By the 2010s, LGBTQ hostility had become a degraded view in the US and the Western world, which is why the post-2010 data is interesting, as it is likely to measure a real increase.
There is a strong correlation between the rise in LGBTQ representation in the media and the dramatic increase in the number of LGBTQ young people, especially when our cultural trend curve is fitted to a graph of young British LGBTQ women.
It could be argued that the causality is the other way round: the media have been sensitive to the growth of LGBTQ people and have served their cultural needs. The correlation is in all likelihood a two-way street: it is true that the media reacts to social changes and tracks trends, but the intense growth of LGBTQ media content has an impact on media consumers, and thus the number of LGBTQ people increases. However, media producers are "tracking" events by producing twice as much LGBTQ content (10%) as the LGBTQ population (4.5%) in the US. Even if we look only at the 18-49 age group that is important to advertisers (2012: 5.1%; 2017: 7%), there is almost 50% more media content compared to that. Even if we were to deny the cultural impact entirely, the challenge is still there: we need to explain the surge in the LGBTQ population with other reasons.
In four or five years, such ground-breaking changes - in America +41% growth in Generation Y, in England +40% for men in the youngest age group, +96% for women - cannot be ignored. This is a very short period of time, and it is difficult to find a reason for this other than cultural influences. How likely is it that 38% more young British women will identify as bisexual in 2015 compared to the previous year? Are they suddenly so much more trusting of research institutions? If it is not cultural influence and not an increase in trust, what is causing the phenomenon?
It follows that there is a strong indication from the statistical data that the claim that current methods of LGBTQ sensitisation are merely empathy-building and have no effect on increasing the number of LGBTQ people, at least among young adults, is false.
The cultural influence pushes a part of the young population, especially women, into a "superposition" in terms of sexual orientation and partly gender identity, so that the LGBTQ community is dynamically growing with them, which then becomes a reference for even wider social and cultural representation.
In America and England, LGBTQ sensitivity programmes are currently being introduced into the curriculum in primary and secondary schools[6]. It is clear to see how these significant cultural influences of LGBTQ have impacted on young adults. If it has had such an impact on adults, what will it do to children and teenagers?
author: Ferenc Karsánszky
This article was first published in Hungarian at the website "Vasarnap" in 2020.
1. GLAAD Media Institute: Where we are on TV, 2019-2020 . This is the proportion of permanent actors in series. Cable and streaming channels are measured separately. [back]
2. Gallup Daily tracking survey, 2012-2017 [back]
3. Sexual orientation, UK, 2014-2018 [back]
4. Sexual Behavior, Sexual Attraction, and Sexual Identity in the United States: Data from the 2006–2010 National Survey of Family Growth; 2011
Sexual Behavior, Sexual Attraction, and Sexual Orientation Among Adults Aged 18–44 in the United States: Data From the 2011–2013 National Survey of Family Growth;2016 [back]
5. Although the time span of the data series is short to judge this. [back]
6. England: in 2019, a law on LGBT curriculum inclusion in primary and secondary schools was passed:
LGBTQ+ inclusive lessons are now mandatory in all schools across England
USA: California passed the first law on LGBT history in schools in 2011, with Colorado and New Jersey joining in 2019. In addition to integrating LGBT history into the curriculum, the topic is also included in sex education. The education is not optional, it is compulsory.